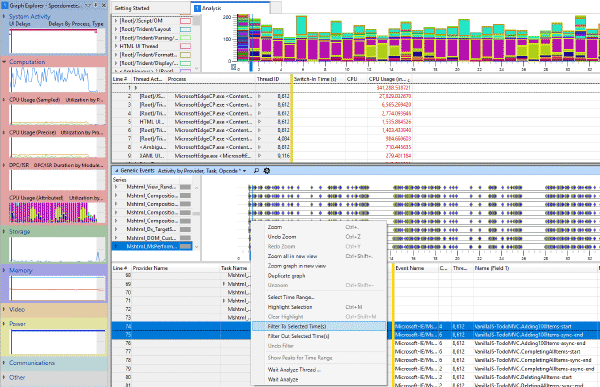
In a recent post, I showed how to view performance.mark()s in WPA. This post is a small follow-on on how to
simplify and automate that process to make performance analysis easier.
Regions of Interest#
Regions of Interest is a native WPA concept that provides the capability of visualizing and zooming to an interesting part of a trace easily.
Using Regions with performance.mark#
Now that we know how to get performance.mark() to emit ETW events, we can write a Regions of Interest file to automatically
pull those events into a graph. It isn’t too difficult to write your own regions file, here’s a sample
one for Edge that assumes we’re looking for two measures, one called “Widget Load” with marks named widgetload-start and
widgetload-end, and the other named “Flyout Animation” and marked by animation.flyout.begin and animation.flyout.end:
<?xml version="1.0" encoding="utf-8" standalone="yes"?>
<InstrumentationManifest>
  <Instrumentation>
    <Regions>
      <RegionRoot Guid="{aac4e926-e56e-4fd8-bd18-e0af3656558a}" Name="My App Scenarios">
        <Region Guid="{fac57cdb-bc3d-41b9-9d12-fa755a39be94}" Name="Widget Load">
          <Match>
            <Event TID="true" PID="true" />
          </Match>
          <Start>
            <Event Provider="{9e3b3947-ca5d-4614-91a2-7b624e0e7244}" Id="211" Version="0" />
            <PayloadIdentifier FieldName="Name" FieldValue="WidgetLoad-Start" />
          </Start>
          <Stop>
            <Event Provider="{9e3b3947-ca5d-4614-91a2-7b624e0e7244}" Id="211" Version="0" />
            <PayloadIdentifier FieldName="Name" FieldValue="WidgetLoad-End" />
          </Stop>
        </Region>
        <Region Guid="{2c8c2da9-5930-4c78-85dd-1f9b83d462f6}" Name="Flyout Animation">
          <Match>
            <Event TID="true" PID="true" />
          </Match>
          <Start>
            <Event Provider="{9e3b3947-ca5d-4614-91a2-7b624e0e7244}" Id="211" Version="0" />
            <PayloadIdentifier FieldName="Name" FieldValue="animation.flyout.begin" />
          </Start>
          <Stop>
            <Event Provider="{9e3b3947-ca5d-4614-91a2-7b624e0e7244}" Id="211" Version="0" />
            <PayloadIdentifier FieldName="Name" FieldValue="animation.flyout.end" />
          </Stop>
        </Region>
      </RegionRoot>
    </Regions>
  </Instrumentation>
</InstrumentationManifest>
The format is pretty straightforward, but why do all that copy / pasting and GUID creation? We easily can generate these files for both Chrome and Edge!
Auto-generating Regions files#
I’ve created a simple PowerShell script called New-RegionsXml.ps1 and put it up on GitHub. To create
a Regions of Interest file for both Chrome and Edge, just supply a collection of objects with Name, Start, and Stop,
properties. Here’s the same example as before:
PS> $measures = @(
        @{
            Name = "Widget Load";
            Start = "WidgetLoad-Start";
            Stop = "WidgetLoad-End"
        },
        @{
            Name = "Flyout Animation";
            Start = "animation.flyout.begin";
            Stop = "animation.flyout.end"
        }
    )
PS> $measures | .\New-RegionsXml.ps1 -RootName "My App Scenarios"
NOTE: If you aren’t familiar with PowerShell,
@()is the shorthand syntax for an array, and@{}is shorthand for a hashtable, much like an object literal in JavaScript.
The output will be two Regions files, one for Chrome and one for Edge, which can be loaded in WPA.
The script supports any event provider(s), the default value of -EventProviders, as previously mentioned is Edge and Chrome
@(
    @{
        Name = "Edge";
        Provider = [Guid]"9e3b3947-ca5d-4614-91a2-7b624e0e7244";
        Id = 211;
        Version = 0;
        FieldName = "Name"
    },
    @{
        Name = "Chrome";
        Provider = [Guid]"d2d578d9-2936-45b6-a09f-30e32715f42d";
        Id = 1;
        Version = 0;
        FieldName = "Name"
    }
)
but you can override it with anything you like.
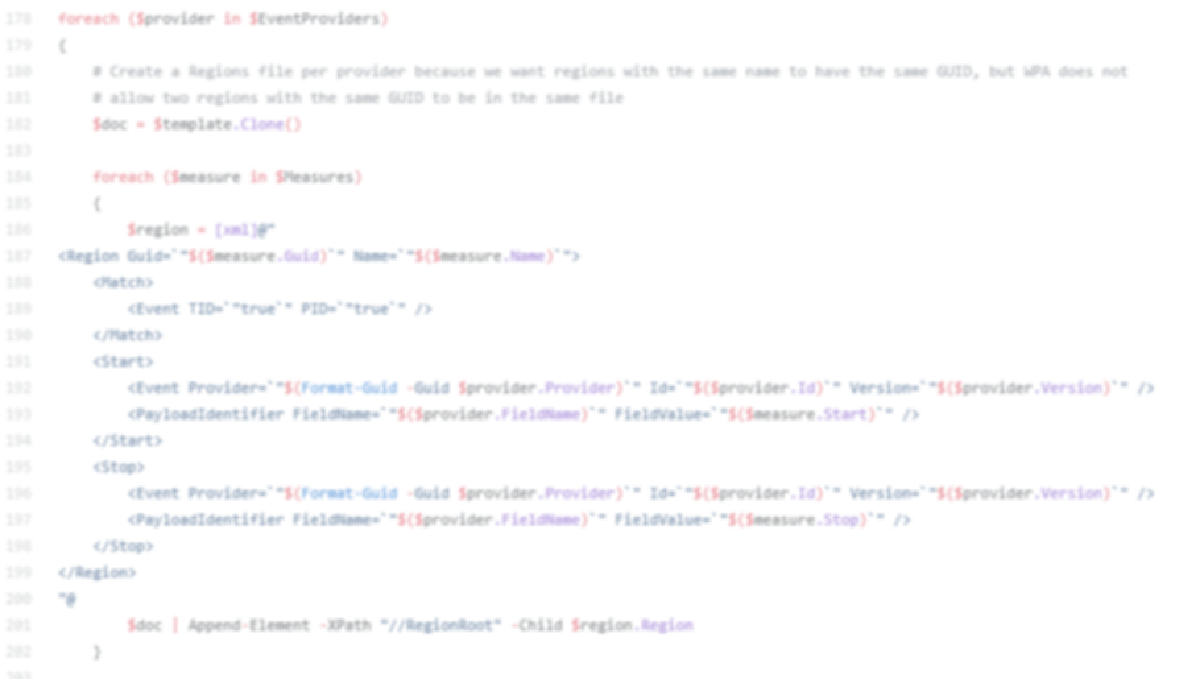
Here’s an example of of a popular benchmark that exposes each test step as a set of marks, and those marks have been turned into WPA regions:
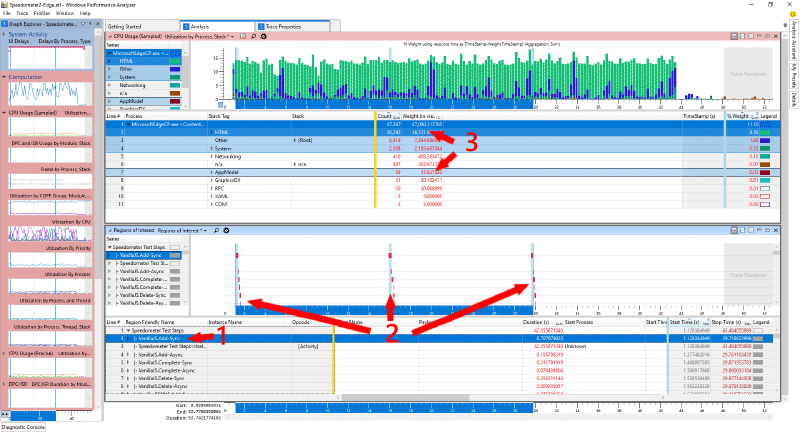
Notice that by selecting a region of interest (item 1), each occurrence of that region is selected not just in the Regions chart (item 2), but also in the CPU Usage chart (item 3), making it super simple to zoom in and out of the trace; much easier to understand what’s happening now!
Ideally browsers would export the User Timings directly into the ETW stream like they do in the F12 developer tools, but until then this script should make things a bit simpler.